
Describing Pie Charts: Part 1
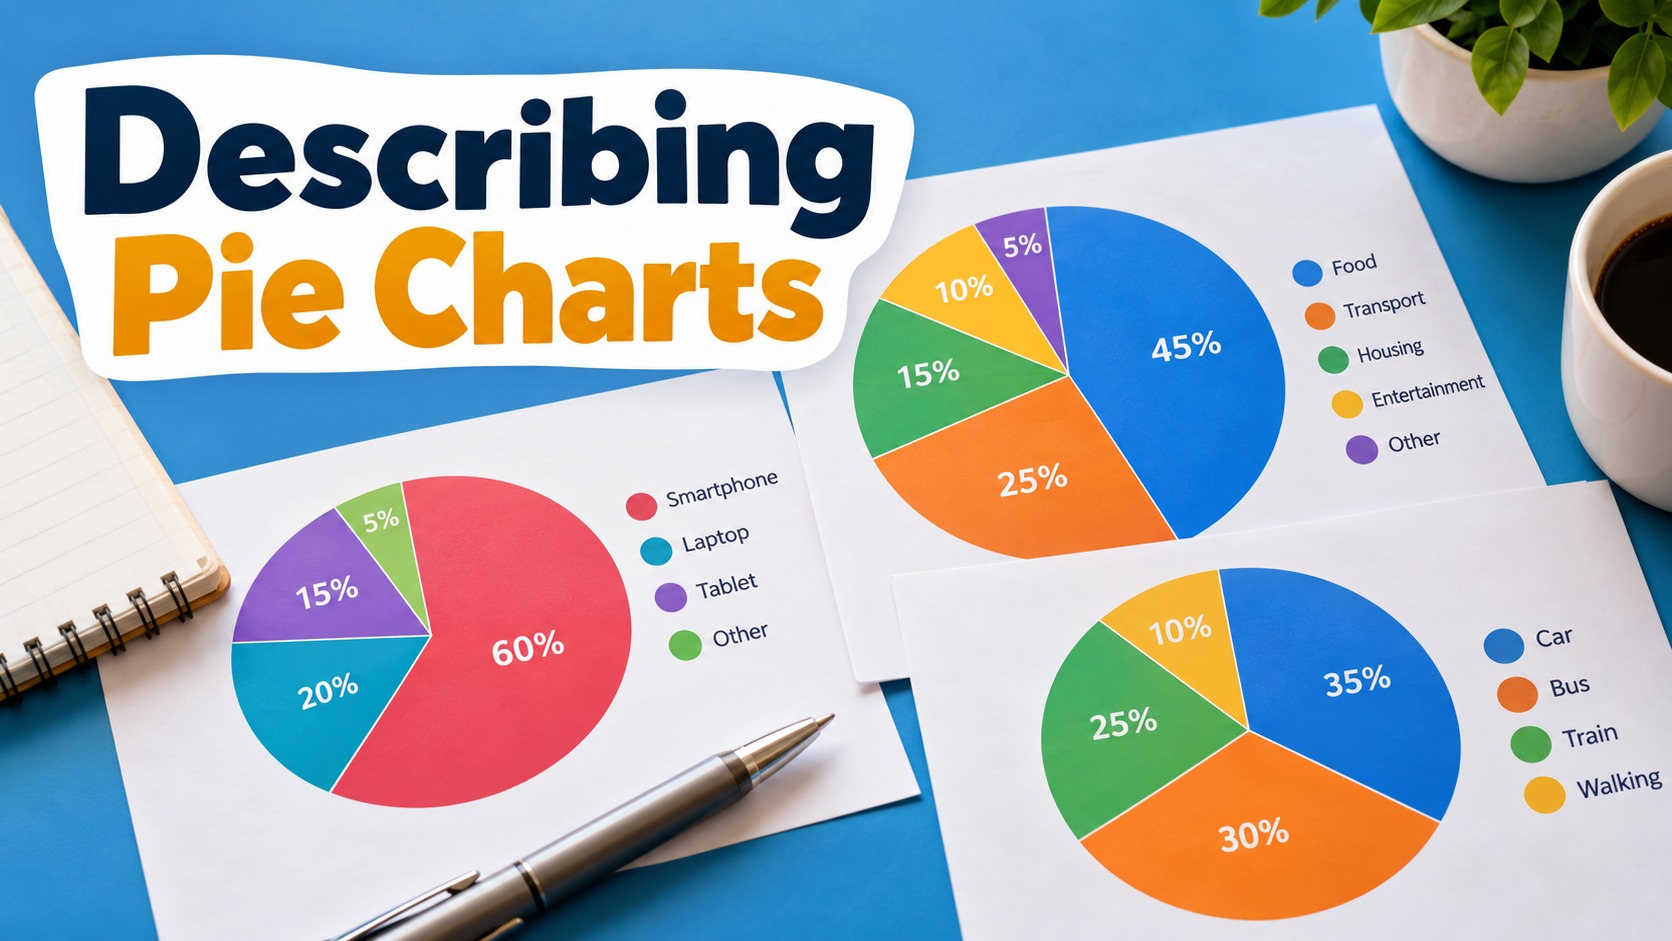
Pie charts show how a whole is divided into different categories. When presenting this type of data, you need to describe proportions accurately and compare the relative sizes of different segments.
Study each of the six pie charts and complete its description using the drop-down menus. More than one answer may be correct, so consider which expressions communicate the data accurately and naturally. Select Check answer before moving to the next question.