
Describing Graphs and Trends
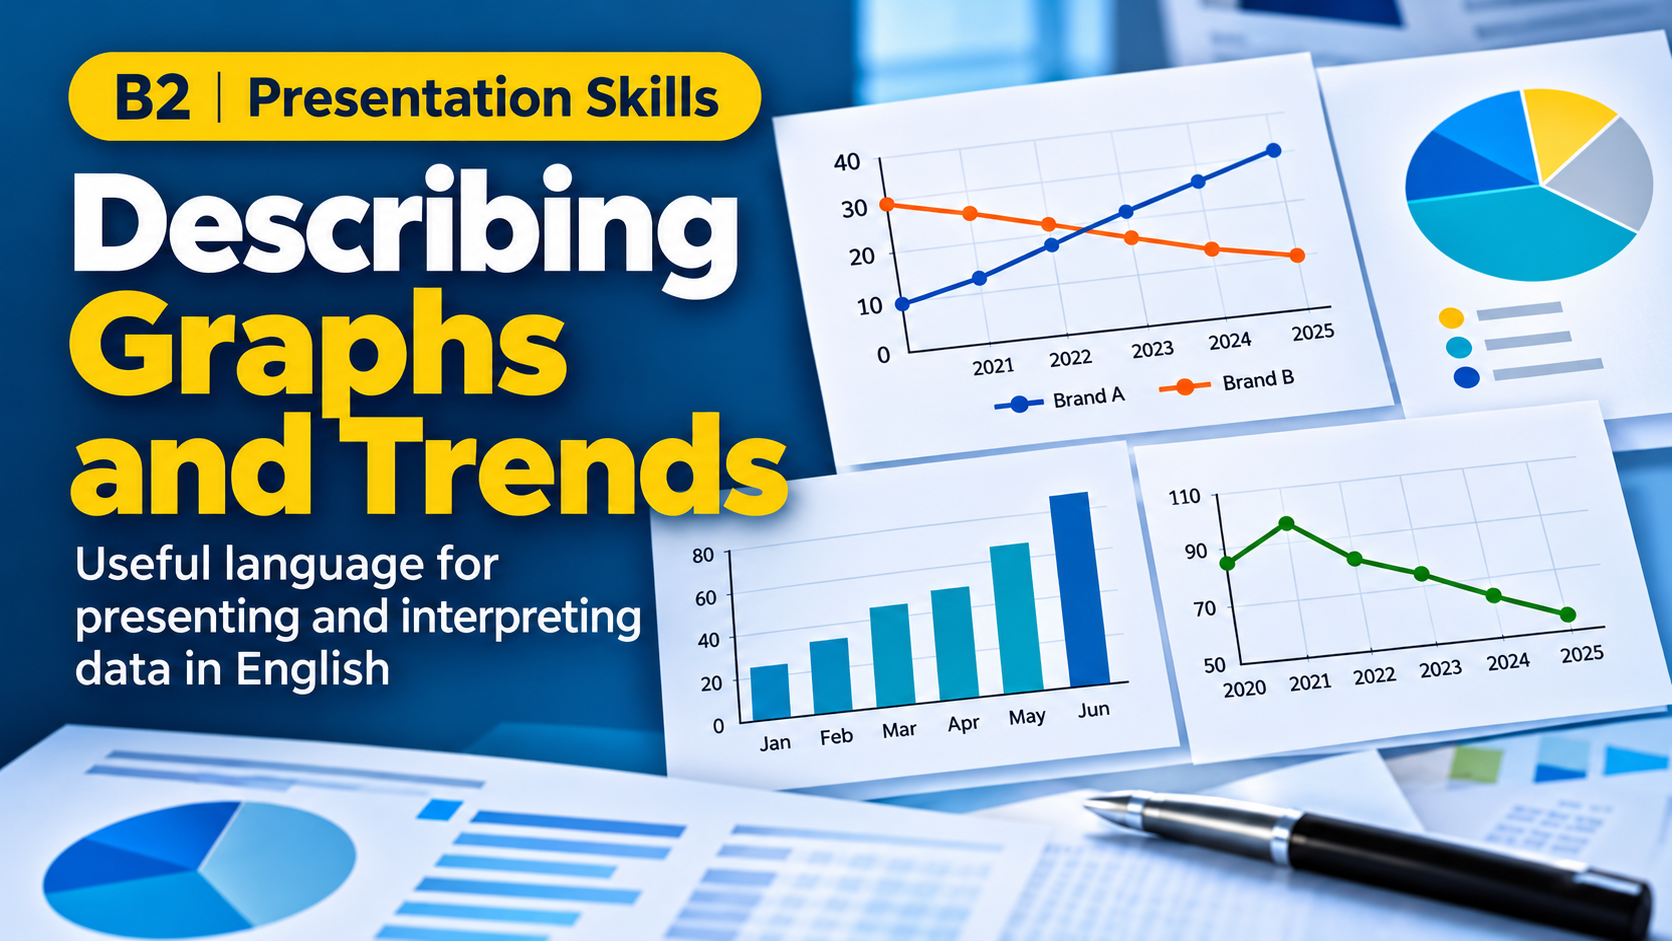
When presenting data, it is important to describe patterns accurately and choose language that reflects what the figures show. This exercise introduces useful expressions for describing increases, decreases, fluctuations, comparisons and changes over time.
Complete both pages. On Page 1, choose the most appropriate expression for each graph. On Page 2, complete the sentences using one or two words. Several answers may be accepted, so pay attention to the feedback and alternative expressions provided.